Part 1: Central Bank Policy Influences Demand for Household Credit
On Jeffrey P Sniders missive re: BLS stats, DDLA had commented: "If one looks at Potential Gross Domestic Product, either real or nominal, one can see that over the last 60 years it has been declining. This is not happening because of monetary policy but because of the export of capital. Businesses are moving as much of their operations as they can overseas. Less capital formation means not only less growth but less potential for growth. There is no capitalism without capital."
To which Salmo Trutta aptly responded:
"This is not happening because of monetary policy"???
Indeed it is. It's called the deregulation of interest rates.
The Nattering one mused:
Salmo,
DDLA does bring up an interesting point. Capital has been gravitating towards yield (labor atthe margin, cheaper end product) since post WWII. Witness the post war rise of manufacturing and the subsequent global importation of goods, primarily by the US from these countries (not in any particular order) Japan, Germany, Korea, Singapore, Taiwan, Indonesia, Malaysia, Philippines etc. most pronounced through China since 1990.
While this has had some effect on the industrial or commercial lending side, it cannot take full credit (no pun intended) for the lowering of rates, as you have thoroughly outlined above.
At the same time, with regard to household debt instrument and mortgages since 1950... and the demand for credit thereof:
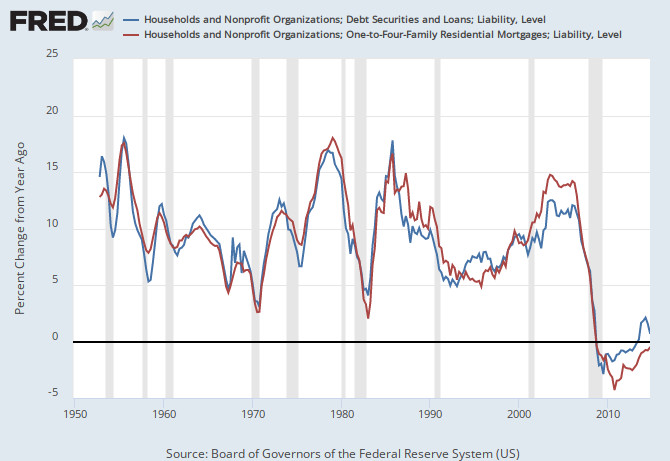
This FRED graph shows YOY delta percentage (credit and mortgage). As expected demand fluctuates with recessions showing a declining growth rate, especially pronounced since 2007 when households bore the brunt of our current depression.

This FRED graph shows YOY delta in total dollar volume since 1950. As expected, excepting the period 2007 - 2010, the YOY delta in volume has grown exponentially.

This FRED graph shows the total amount of household debt instruments. As expected, since 1950, the total dollar amount has grown exponentially with a downturn 2008 - 2010, and subsequent reflation nearing the 2008 peak.

These three graphs speak for themselves and demonstrate that for household credit and mortgages and the demand thereof:
1. the YOY delta % fluctuates depending on overall economic conditions with declines in recessionary times.
2. the YOY delta in billions of dollars rises exponentially excepting 2007 - 2010, then resumes its upward trend.
3. the total amount of debt had been rising exponentially since 1950, with a brief decline 2008 - 2010, then reflating almost to its 2008 peak.
Since rates have gone down since 1950, none of the above is due to higher rates, but due to declining real household income, declining real GDP, increased housing inflation, and overall inflation. This would be referred to as stagflation.
Since 1950, the total amount of debt in household credit and mortgages has increased from 73 Billion to a peak of 14 Trillion in 2008, and is currently est. at 13.5 Trillion.
These graphs do not speak to the overall number of transactions, but only to the dollar volume and total of debt. As for any overall decline in the demand for household debt and mortgages which might have a suppressing effect on rates, it would not be apparent from this data.
More to come in Part 2.
To which Salmo Trutta aptly responded:
"This is not happening because of monetary policy"???
Indeed it is. It's called the deregulation of interest rates.
The Nattering one mused:
Salmo,
DDLA does bring up an interesting point. Capital has been gravitating towards yield (labor atthe margin, cheaper end product) since post WWII. Witness the post war rise of manufacturing and the subsequent global importation of goods, primarily by the US from these countries (not in any particular order) Japan, Germany, Korea, Singapore, Taiwan, Indonesia, Malaysia, Philippines etc. most pronounced through China since 1990.
While this has had some effect on the industrial or commercial lending side, it cannot take full credit (no pun intended) for the lowering of rates, as you have thoroughly outlined above.
At the same time, with regard to household debt instrument and mortgages since 1950... and the demand for credit thereof:
This FRED graph shows YOY delta percentage (credit and mortgage). As expected demand fluctuates with recessions showing a declining growth rate, especially pronounced since 2007 when households bore the brunt of our current depression.
This FRED graph shows YOY delta in total dollar volume since 1950. As expected, excepting the period 2007 - 2010, the YOY delta in volume has grown exponentially.

This FRED graph shows the total amount of household debt instruments. As expected, since 1950, the total dollar amount has grown exponentially with a downturn 2008 - 2010, and subsequent reflation nearing the 2008 peak.

These three graphs speak for themselves and demonstrate that for household credit and mortgages and the demand thereof:
1. the YOY delta % fluctuates depending on overall economic conditions with declines in recessionary times.
2. the YOY delta in billions of dollars rises exponentially excepting 2007 - 2010, then resumes its upward trend.
3. the total amount of debt had been rising exponentially since 1950, with a brief decline 2008 - 2010, then reflating almost to its 2008 peak.
Since rates have gone down since 1950, none of the above is due to higher rates, but due to declining real household income, declining real GDP, increased housing inflation, and overall inflation. This would be referred to as stagflation.
Since 1950, the total amount of debt in household credit and mortgages has increased from 73 Billion to a peak of 14 Trillion in 2008, and is currently est. at 13.5 Trillion.
These graphs do not speak to the overall number of transactions, but only to the dollar volume and total of debt. As for any overall decline in the demand for household debt and mortgages which might have a suppressing effect on rates, it would not be apparent from this data.
More to come in Part 2.
Comments