COTS: The Early Edition?
Following up on Q1 GDP Surge?
In addition, the FOMC backs are to the wall, they must continue to raise to get off ZIRP levels for any hope of sparking dormant money through lending. Also, any cuts will be perceived as policy failures and an admission to the aforementioned econometric falsity.
Making matters worse, Mr. Market has priced in over 99% probability of 50bps in cuts before year end. But that is not the shocking news, what is?
While few were paying attention... since May 8, 2018: 3 month (90 day) Eurodollar net commercial positions went from +4.8M long to -1M short.
Remember LONG means higher ED contract value = LOWER rates. SHORT means lower ED contract value = HIGHER rates.
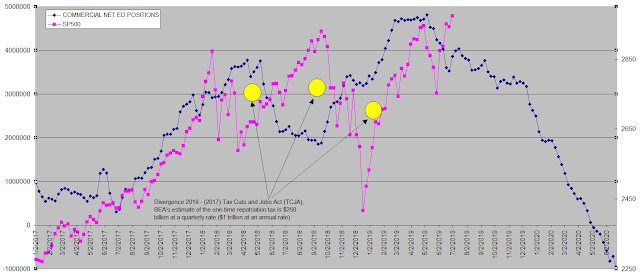 Above, 2017-2019 ED COTS (Commitment of Traders) moved forward by 52 weeks vs SP500 weekly adjusted close.
Translated Commercial elephants have stampeded away from a massive LOWER rate hedge position to a HIGHER rate hedge position.
Could the ED COTS positions be a clue for the direction of the market going forward? Since 2007, quite accurately with some divergences during monetary disturbances QE1, 2, 3, and the 2018 TCJA repatriation of $1T in corporate funds.
Note in the chart above, the most rapid decline (as in straight down) occurred between December 9, 2018 and present. Slide that forward one year to track the SP500, just in time for the end of this year?
Nothing like getting the early edition? TBD.
More to come in TEU Be Cass-T Down? Stay tuned, no flippin.
"There is some latent support, based on a reversal in E-$ demand, for a continued rally in stocks. The top in yields came late after the turn, after Pivot ↑ #4 on 6/19 (indicative of economic weakness).." @Salmo trutta 02 Jul 2019, 08:22 PMQ1 GDP was actually 1.5, Q2 will be advertised at 1.4, but actually be -0.3. Q3 will be even worse. So no Fed cuts till year end, if then. Remember, the Fed is drunk on their own punch, spiked with econometric falsity (GDP, BLS Unemployment, CPI, PCE).
In addition, the FOMC backs are to the wall, they must continue to raise to get off ZIRP levels for any hope of sparking dormant money through lending. Also, any cuts will be perceived as policy failures and an admission to the aforementioned econometric falsity.
Making matters worse, Mr. Market has priced in over 99% probability of 50bps in cuts before year end. But that is not the shocking news, what is?
While few were paying attention... since May 8, 2018: 3 month (90 day) Eurodollar net commercial positions went from +4.8M long to -1M short.
Remember LONG means higher ED contract value = LOWER rates. SHORT means lower ED contract value = HIGHER rates.

Translated Commercial elephants have stampeded away from a massive LOWER rate hedge position to a HIGHER rate hedge position.
Could the ED COTS positions be a clue for the direction of the market going forward? Since 2007, quite accurately with some divergences during monetary disturbances QE1, 2, 3, and the 2018 TCJA repatriation of $1T in corporate funds.
Note in the chart above, the most rapid decline (as in straight down) occurred between December 9, 2018 and present. Slide that forward one year to track the SP500, just in time for the end of this year?
Nothing like getting the early edition? TBD.
More to come in TEU Be Cass-T Down? Stay tuned, no flippin.
Comments