Connecting The Dots Part 5
In this series, we will examine and connect the dots, on several topics, all of which are contributing to stagflation, low interest rates, negative economic growth, and the greatest asset bubbles of all time.
After reviewing The Supply Side Melt Down behind Door #1, let's see whats behind Door #2....
The Reserve Side Melt Up
As mentioned in our last installment, Secular Stagnation and QE lead to:
D. + increased need for savings
E. + increased demand for low risk assets
F. - shrinking pool of low risk assets
The issuers of low risk instruments (The Banks and The Fed) hold them as a liability, while using your cheap money to repay their liabilities. As they directly benefit ($1 Trillion annually) from this erosion, your loss of purchasing power is their gain and is in effect a transfer of wealth from the conservative saving sector to the high risk gambling sector.
Thus far, the public has been willing to pay, er... call it stagflation, call it a tax, call it what you want, but you must call it a $1 Trillion a year in opportunity costs. But it gets better, and it always does...
Since 2008, due to risk aversion, there has been strong demand for cash and equivalents. At some point, as risk aversion declines, the public will be less likely to hold safe assets that suffer this degree of erosion and will invest their cash and borrowings in higher rate of return assets. Investors with exit fixed income and transition into equities. Check out an awesome set of charts from Donald Hagan at Day Hagan.
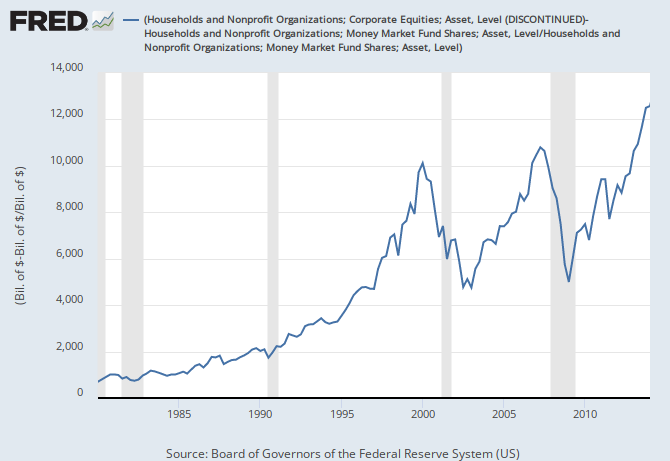
Total Market Value vs Money Market Fund Assets

Above money market fund assets as a % of total market value 12.4% which is a level consistent with low liquidity. Notice the three hanging chins corresponding with market collapses. Look where we are now, a fourth chin.
Ratio Total Equity Fund vs Money Market Fund Assets

The scale on the left is actually the ratio of equity funds to mutual funds, in 2000 its 10 to 1; in 2008 11 to 1; today 12.5 to 1 and never higher. Again, peaks correspond with market blow offs.
With the sunset of employer contributed pension plans and the dawn of the 401K trap, in which most investment funds can't beat their own benchmarks, and suffer further principal erosion through management fees, many investors are looking for alternatives.
Some investors are making the jump to equities in an effort to avoid the 401K trap and buy supplemental income through dividend growth investing. In a recent survey, respondents allocation to equities is 67%, just below the 2008 peak of 70% and the 2000 peak of 75%.
Stocks as a % of Household Financial Assets (Adjusted for Pension Funds)

The Fed data above isn't as "invested" as the survey, but shows we are only 11% below the all time high for Fed data.
Total Household Financial Assets as a % of Disposable Personal Income

Scary how this chart resembles the Total Equity Fund vs Money Market Fund Assets chart. Historically when this ratio exceeds 4.5, this indicates an investor ALL IN position which results in a market collapse.
Two little details... The Fed is already active in reverse repos, basically overnight borrowing by the Fed, offering lenders the equivalent of up to 5 basis points in interest. (We covered the function of the Repo market in The Temple Grandin of Shadow Banking 1-2-3.) In addition, IOER - Interest On Excess Reserves...
On Wall Street, foreign banks borrow from money market funds at 3-6 basis points, then deposit the funds as excess reserves at the Fed, which pays them 25 basis points. Nice arb, carry trade or, a license to print money. Why aren't domestic banks following suit? Unlike the foreign banks, they have to pay FDIC fees on their borrowings.
With everyone chasing the bag, and not to be outdone, the banks (holding $2.9 trillion in excess reserves) will become inclined to lend out their reserves for a higher yield.
To discourage this behavior and counter the multiplier effect, in both cases, IOER & reverse repo, the Fed will have to either drain reserves or increase the interest it pays on those reserves, otherwise the wealth of reserves will lead to excess money supply.
At the same time, in a synergistic fashion, as risk aversion and the demand for cash declines, the public and banks will inflate the price of higher risk assets and put additional pressure on short term yields to rise, causing inflation and rising rates which the Fed will not be able to control.
And when that happens remember what we said in Part 3: as interest rates go up, the velocity of the money in the system goes up. More on this later.
Much like The Supply Side Melt Down, behind Door #1, no happy ending to be had here either. What's next? More to come as we look to see what is behind Door #3. But first...
Speaking of happy endings, it was used in the Full Monty, not you Mr. Hall, but I will always remember seeing it used in this 1986 film first. Thank you, Randy Newman.
After reviewing The Supply Side Melt Down behind Door #1, let's see whats behind Door #2....
The Reserve Side Melt Up
As mentioned in our last installment, Secular Stagnation and QE lead to:
D. + increased need for savings
E. + increased demand for low risk assets
F. - shrinking pool of low risk assets
The issuers of low risk instruments (The Banks and The Fed) hold them as a liability, while using your cheap money to repay their liabilities. As they directly benefit ($1 Trillion annually) from this erosion, your loss of purchasing power is their gain and is in effect a transfer of wealth from the conservative saving sector to the high risk gambling sector.
Thus far, the public has been willing to pay, er... call it stagflation, call it a tax, call it what you want, but you must call it a $1 Trillion a year in opportunity costs. But it gets better, and it always does...
Since 2008, due to risk aversion, there has been strong demand for cash and equivalents. At some point, as risk aversion declines, the public will be less likely to hold safe assets that suffer this degree of erosion and will invest their cash and borrowings in higher rate of return assets. Investors with exit fixed income and transition into equities. Check out an awesome set of charts from Donald Hagan at Day Hagan.
Total Market Value vs Money Market Fund Assets

Above money market fund assets as a % of total market value 12.4% which is a level consistent with low liquidity. Notice the three hanging chins corresponding with market collapses. Look where we are now, a fourth chin.
Ratio Total Equity Fund vs Money Market Fund Assets
The scale on the left is actually the ratio of equity funds to mutual funds, in 2000 its 10 to 1; in 2008 11 to 1; today 12.5 to 1 and never higher. Again, peaks correspond with market blow offs.
With the sunset of employer contributed pension plans and the dawn of the 401K trap, in which most investment funds can't beat their own benchmarks, and suffer further principal erosion through management fees, many investors are looking for alternatives.
Some investors are making the jump to equities in an effort to avoid the 401K trap and buy supplemental income through dividend growth investing. In a recent survey, respondents allocation to equities is 67%, just below the 2008 peak of 70% and the 2000 peak of 75%.
Stocks as a % of Household Financial Assets (Adjusted for Pension Funds)

The Fed data above isn't as "invested" as the survey, but shows we are only 11% below the all time high for Fed data.
Total Household Financial Assets as a % of Disposable Personal Income

Scary how this chart resembles the Total Equity Fund vs Money Market Fund Assets chart. Historically when this ratio exceeds 4.5, this indicates an investor ALL IN position which results in a market collapse.
Two little details... The Fed is already active in reverse repos, basically overnight borrowing by the Fed, offering lenders the equivalent of up to 5 basis points in interest. (We covered the function of the Repo market in The Temple Grandin of Shadow Banking 1-2-3.) In addition, IOER - Interest On Excess Reserves...
On Wall Street, foreign banks borrow from money market funds at 3-6 basis points, then deposit the funds as excess reserves at the Fed, which pays them 25 basis points. Nice arb, carry trade or, a license to print money. Why aren't domestic banks following suit? Unlike the foreign banks, they have to pay FDIC fees on their borrowings.
With everyone chasing the bag, and not to be outdone, the banks (holding $2.9 trillion in excess reserves) will become inclined to lend out their reserves for a higher yield.
To discourage this behavior and counter the multiplier effect, in both cases, IOER & reverse repo, the Fed will have to either drain reserves or increase the interest it pays on those reserves, otherwise the wealth of reserves will lead to excess money supply.
At the same time, in a synergistic fashion, as risk aversion and the demand for cash declines, the public and banks will inflate the price of higher risk assets and put additional pressure on short term yields to rise, causing inflation and rising rates which the Fed will not be able to control.
And when that happens remember what we said in Part 3: as interest rates go up, the velocity of the money in the system goes up. More on this later.
Much like The Supply Side Melt Down, behind Door #1, no happy ending to be had here either. What's next? More to come as we look to see what is behind Door #3. But first...
Speaking of happy endings, it was used in the Full Monty, not you Mr. Hall, but I will always remember seeing it used in this 1986 film first. Thank you, Randy Newman.
Comments