Minutia and History Repeating? Part 2
Continuing last weeks theme, from Minutia and History Repeating? with more reasons for that market dip or free fall? On September 20th, 2017 the Fed finally committed to temporal proximity in taking the big QE punch bowl away viz. as to WHEN QT might start?
To recap in italics from Minutia and History Repeating? - Part 1... between June 10 and July 16th, 2017 in four missives we outlined how:

We Nattered on December 13th, 2017, when it was announced that in mid January 2018, the maturity rollover limit on Treasury securities would increase from 6B to 12B, and Agency MBS increases from 4B to 8B.
Translated: All amounts DOUBLED, those under are NOT rolled over, and must be retired or liquidated. To retire money comes from the budget, to liquidate, money comes from the markets to retire additional float.
Timing is Everything?
In 2018, fifteen weeks after October 2017 QT initiation, and four short weeks after the January 2018 doubling of roll over caps, the affect and effects have been felt in markets.
The Fed Treasury float effect has so far been distributed as follows:
Q1 = October 15, 2017 - January 15, 2018
Q2 = January 15, 2018 - April 15, 2018
Treasury roll offs caps in Q1 @ 6B per month =18B; Q2 @ 12B per month =36B; equating to added float of Q1= 3.1%; Q2=6.3%.
MBS roll offs caps in Q1 @ 4B per month =12B; Q2 @ 8B per month =24B; equating to added float of Q1= 7.8%; Q2=15.6%.
From the July 9th, 2014 FOMC minutes release...

Above note what happened to equities after the cumulative $20B reduction on January 15th.

Above note what happened to oil after the cumulative $20B reduction on January 15th. From Fed: Devil In the Details?....
Ancient folk saying: "You can catch the Devil, but you can't hold him long." Ask Brother Jerome. Ask David Ellington. They know, and they'll go on knowing to the end of their days and beyond....
With regard to reasons for a market dip or free fall? More to come in Wages: More is Less?, stay tuned, no flippin.
In October, the Committee will initiate the balance sheet normalization program described in the June 2017 Addendum to the Committee's Policy Normalization Principles and Plans.On October 13th, 2017, the first taper began with Agency MBS paper.
To recap in italics from Minutia and History Repeating? - Part 1... between June 10 and July 16th, 2017 in four missives we outlined how:
the FOMC QT (quantitative tightening) might affect $3T in notional bets or net commercial longs in 90 day Eurodollar futures
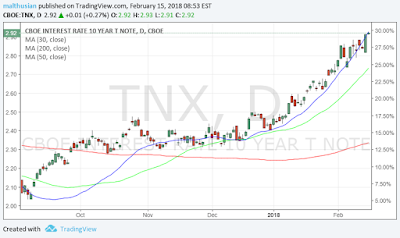
A larger float of available bonds for others to purchase and perhaps less bond purchases? might result in declining bond prices and rising yields

10 Year Bond Yield - Sept 8 2.04; Feb 15 2.93
When bonds get bought, dollars get taken out of circulation. Less dollars, higher dollar. Now consider [bonds being sold] then reverse the last statement. Potential for less dollar volume in bond sales, more dollars floating, lower dollar.

Dollar Index - Oct 27 95.15 - Jan 26 88.43
We Nattered on December 13th, 2017, when it was announced that in mid January 2018, the maturity rollover limit on Treasury securities would increase from 6B to 12B, and Agency MBS increases from 4B to 8B.
Translated: All amounts DOUBLED, those under are NOT rolled over, and must be retired or liquidated. To retire money comes from the budget, to liquidate, money comes from the markets to retire additional float.
Timing is Everything?
In 2018, fifteen weeks after October 2017 QT initiation, and four short weeks after the January 2018 doubling of roll over caps, the affect and effects have been felt in markets.
The Fed Treasury float effect has so far been distributed as follows:
Q1 = October 15, 2017 - January 15, 2018
Q2 = January 15, 2018 - April 15, 2018
Treasury roll offs caps in Q1 @ 6B per month =18B; Q2 @ 12B per month =36B; equating to added float of Q1= 3.1%; Q2=6.3%.
MBS roll offs caps in Q1 @ 4B per month =12B; Q2 @ 8B per month =24B; equating to added float of Q1= 7.8%; Q2=15.6%.
From the July 9th, 2014 FOMC minutes release...
Some committee members had been asked by members of the public whether, if tapering in the pace of purchases continues as expected, the final reduction would come in a single $15 billion per month reduction.The final reduction in Treasury purchases would be $15 billion on October 15, 2014. Contrasting that $15B per month reduction, as opposed to $6B per month ramping to $12B, concomitant with MBS $4B per month ramping to $8B per month, a cumulative $20B all on January 15, 2018.
Open market effects can include higher cost of loan funds and operating costs, further reducing profits and cash flow.
Precious balance sheet capacity gets squeezed, viz. liquidity and the ability to PPT or speculate elsewhere will suffer, and perhaps other holdings might have to be liquidated?

SP500 Sept 8 2459; Jan 26 2872; Feb 9 2532
Above note what happened to equities after the cumulative $20B reduction on January 15th.
QE purchases ending in October 2014, were telegraphed in the July FOMC minutes release, which precipitated a 75% collapse in oil prices.

WTI Oil Oct 6 49.13; Jan 25 66.63; Feb 9 58.06
Above note what happened to oil after the cumulative $20B reduction on January 15th. From Fed: Devil In the Details?....
The Committee expects to learn more about the underlying demand for reserves during the process of balance sheet normalization.Point in fact, much to the benefit of the 1%, the demons of QE, NIRP and ZIRP have created massive global reflation bubbles in all assets, while tightening monetary policy to the point of economic strangulation and asphyxiation, much to the detriment of the rest.
Ancient folk saying: "You can catch the Devil, but you can't hold him long." Ask Brother Jerome. Ask David Ellington. They know, and they'll go on knowing to the end of their days and beyond....
With regard to reasons for a market dip or free fall? More to come in Wages: More is Less?, stay tuned, no flippin.
Comments
Rising yields (public sector) are causing stock / bond rebalancing. We'll know much more as the "monster" auction in progress completes (buying opportunity).
See: China's Yuan Plunges Most Since Aftermath of Devaluation in 2015
ForexFeb 08, 2018 01:00AM ET
https://www.investing.com/news/forex-news/chinas-yuan-plunges-most-since-aftermath-of-devaluation-in-2015-1213798