Wages: More is Less?
Continuing last weeks theme, from Minutia and History Repeating? Part 2, more reasons for that market dip or free fall? As Nattered on Feb 7, 2018 regarding the recent market dip and bogus "good times" Feb 2nd jobs report...
Ok no China Syndrome? Dim Sum caused this market dip? – on the 29th and yesterday we Nattered about increased net foreign holdings of dollar assets, and economic proxies tanking from December till present.
IMHO, some holders know this and the Friday Feb 2nd BLS and MSM fake news exacerbated matters.
On Feb 2nd our jobs report with +200K read, the other part, +2.9% HOURLY wage increase, biggest since the recession, which never ended. So market inflation fears due to "healthy growth" are stoked, bonds sell off and yields rise.
But wait, equities are selling off? I thought the growth in those tea leaves was healthy? Something smells bad and our buddy Charlie wants to have a sniff...
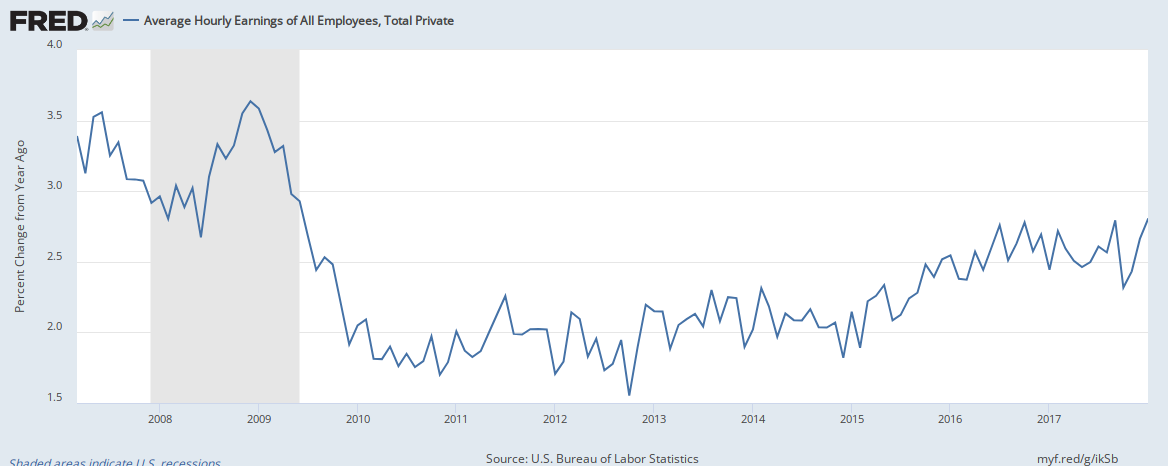
Sorry Charlie, as we need +300 or +400 to have meaningful growth, +200K is a weak number. Further, a +2.9% Yoy increase in HOURLY wages sounds nice, but might as well be fake news, and here's why...
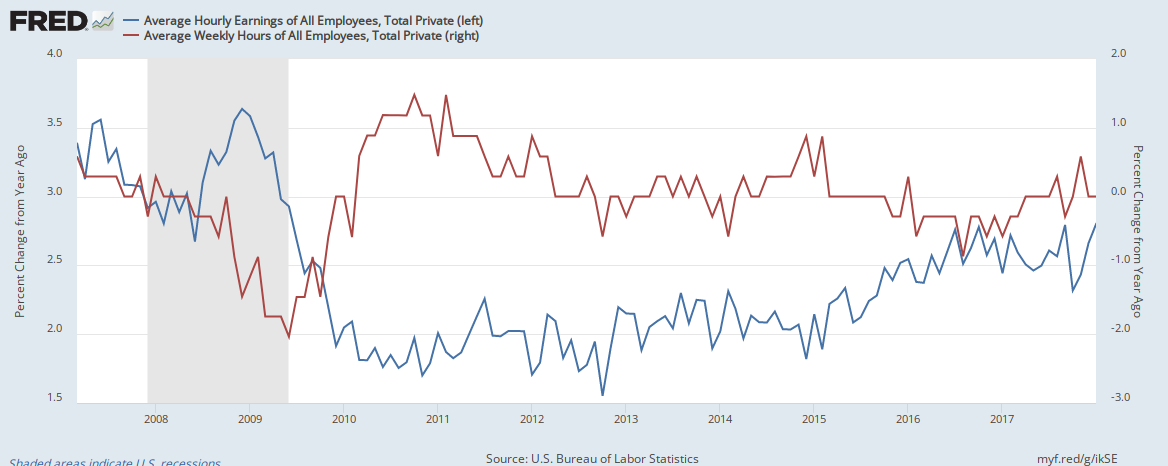
Above, contrasting hourly vs weekly, one can see the relationship: when hourly wages increase, weekly earnings decline. Upon further review average WEEKLY earnings and hours growth rates have both declined since Oct 2010, and are still below that level.

Plotting WEEKLY earnings and hours confirms the above.

Above, plotting HOURLY growth historically, drives the point painfully home. Wage growth peaked early 80's and we are in an emasculated impotent service economy wrought with Senior WalMart greeters and waitresses. Would you like to Super Size that?
How do hourly rates rise while weekly pay declines? Hourly rates increased due to minimum wage laws forcing them up, meanwhile due to benefit avoidance, employers have cut back on weekly hours or total hours worked. So sorry, next contestant.
To repeat…
Between the latent year end economic proxy data above, and the Feb 2nd jobs report, somebody connected the dots, and saw through the BLS and MSM BS, thus making those dollar assets not look so attractive.
Add in Chinese RMB at a 3.5 year high vs USD, good time to sell, if one is planning on devaluing the RMB again? With six you get eggroll? Sum Dim on the BLS report and Dim Sum for thought.
As it did not remotely come close to passing the sniff test, Charlie was glad to take another look at that BLS or BS Tuna roll. Thank you Charlie and Happy 57th.
Ok no China Syndrome? Dim Sum caused this market dip? – on the 29th and yesterday we Nattered about increased net foreign holdings of dollar assets, and economic proxies tanking from December till present.
IMHO, some holders know this and the Friday Feb 2nd BLS and MSM fake news exacerbated matters.
On Feb 2nd our jobs report with +200K read, the other part, +2.9% HOURLY wage increase, biggest since the recession, which never ended. So market inflation fears due to "healthy growth" are stoked, bonds sell off and yields rise.
But wait, equities are selling off? I thought the growth in those tea leaves was healthy? Something smells bad and our buddy Charlie wants to have a sniff...
Sorry Charlie, as we need +300 or +400 to have meaningful growth, +200K is a weak number. Further, a +2.9% Yoy increase in HOURLY wages sounds nice, but might as well be fake news, and here's why...
Above, contrasting hourly vs weekly, one can see the relationship: when hourly wages increase, weekly earnings decline. Upon further review average WEEKLY earnings and hours growth rates have both declined since Oct 2010, and are still below that level.
Plotting WEEKLY earnings and hours confirms the above.
Above, plotting HOURLY growth historically, drives the point painfully home. Wage growth peaked early 80's and we are in an emasculated impotent service economy wrought with Senior WalMart greeters and waitresses. Would you like to Super Size that?
How do hourly rates rise while weekly pay declines? Hourly rates increased due to minimum wage laws forcing them up, meanwhile due to benefit avoidance, employers have cut back on weekly hours or total hours worked. So sorry, next contestant.
To repeat…
Since mid Dec. Yen gaining on the dollar, tight liquidity. Baltic dry shipping, bond yields, money supply, interbank lending, commercial and industrial lending, all TANKED.These are all proxies of systemic economic growth, which have NOTHING to do with the markets?
Between the latent year end economic proxy data above, and the Feb 2nd jobs report, somebody connected the dots, and saw through the BLS and MSM BS, thus making those dollar assets not look so attractive.
Add in Chinese RMB at a 3.5 year high vs USD, good time to sell, if one is planning on devaluing the RMB again? With six you get eggroll? Sum Dim on the BLS report and Dim Sum for thought.
As it did not remotely come close to passing the sniff test, Charlie was glad to take another look at that BLS or BS Tuna roll. Thank you Charlie and Happy 57th.
Comments