Asleep at the Wheel - Part II

The Prudent Investor comments "the latest money supply figures for both the dollar and the Euro-area indicate an acceleration of the (electronic) printing presses.
While seasonally adjusted M3 money stock rose 7.6% year-on-year in the US, the European Central Bank (ECB) reported a further jump in M3 growth from 8.2 to 8.5% for September, saying that the growth relied on further credit expansion to both consumers and governments."
In addition, an unpleasant trend at the Fed "the Fed will discontinue publication of M3 figures after March 2006. Such a step may fit in the policy of the current Bush administration but certainly not a supposedly independent central bank.
M3 is the most important money aggregate for economists, analysts and Fed watchers to get an idea at what speed the (electronic) printing press is running.
M3 has been growing at an annual rate of 7.5 percent or double the most recent rate of GDP growth (subject to a revision.) Since Bush took office money supply M3 has risen by 40%."
Actually, according to the FED M3 data 1/1/96 M3 = 4653 Billion; 1/1/00 M3 = 6614 B; therefore M3 growth 1996-2000 which was Clintons last term = 42%, Bush's M3 growth record is far, far worse than this.
This is a prime example of how percentages, indexes and statistics lead people astray. On the surface a 7.5% annual growth rate and a Bush administration increase of 40% sound quite benign and don't really put this disaster into perspective. This will...
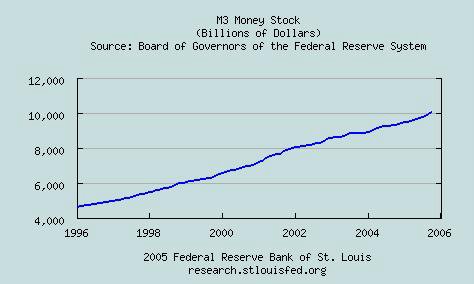
In less than nine years, M3 has increased the equivalent of 116% of the total money supply that existed on Jan 1st, 1996.
Of the 116% money supply growth since 1996, 74% of that total, occured since 2000 i.e. since Bush took office. Coincidence?
1/1/59 M3 = 289 B; 1/1/96 M3 = 4653 B; 1/1/00 M3 = 6614 B; 11/1/05 M3 = 10075 B; therefore, the amount of money created in the last 70 months = 3461 Billion and in the last 9 years = 5422 Billion. By the way, 3460 Billion is a 52.4% increase in the previous M3 level under Bush, not 40%.
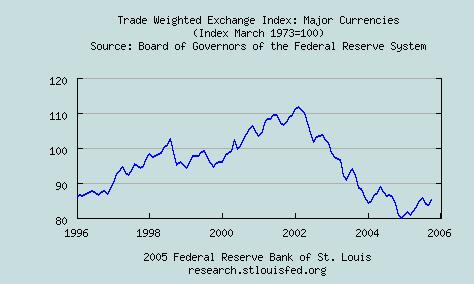
Another example of how indexed values and percentages conive numbers and lie like rugs: The dollar index from 1996 @ 88 through 2002 @ 112, an index increase of 24 divided by 88 = 27% increase in dollar value against other major currencies. The numbers look bigger going up...
From 2002 @ 112 through Jan 2005 @ 80, a decrease of 32 index points divided by 112, a dollar decrease of 28.5% in value against other major currencies. The numbers look smaller coming down...
When in fact the dollar retraced the 96 - 02 24 index point or 27% increase; and fell another 8 index points or 9% of its 1996 value. That my friends is called sleight of hand and its how men in suits with briefcases and calculators in hand, rob the public blind while it sleeps.
The banking system, financial houses, asset speculators, governments and big oil have profited immensely. Meanwhile, my friends, pensioners and the average working stiff got screwed royally without lubricant or even the decency of a reach around.
Should the Treasury need to crank up the printing presses again, which we suspect they will to finance the deficits, the war, Katrina's infrastructure damage, social security and medicare reform, we can expect M3 growth to equal 100% of todays M3 within a 5 year span or less.
Either interest rates soar soon and a clamp down on M3 overliquification occurs, or after the coming deflation, we are going to see hyperinflation of assets that will make our recent asset bubble cycle look tame.
M3 of 20,000 Billion in 2010 is not out of the question. This explains the easy money asset bubbles; conspicuous consumption and why the Fed will no longer keep the M3 statistic. More to come in Part III.
Comments