Mad Natterings 02/07/16
The disaster BLS non farms payroll on Friday touted "surging wages and an unemployment rate at an 8 year low"...
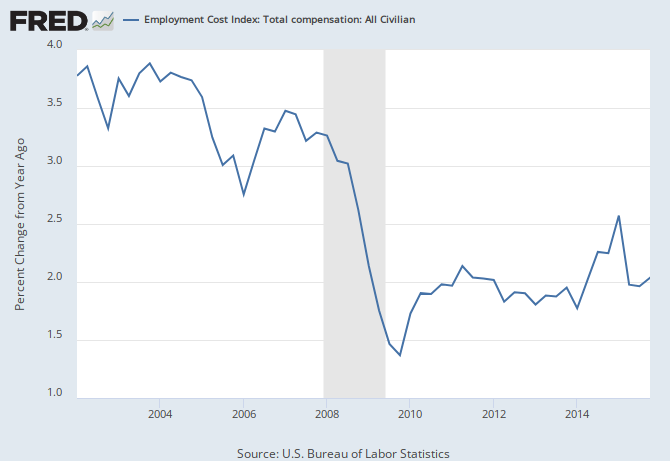
Surging wages? Anyone of sound mind can tell by looking at the above chart, that assertion is pure unadulterated BS. An eight year low in unemployment? Let's see about that...
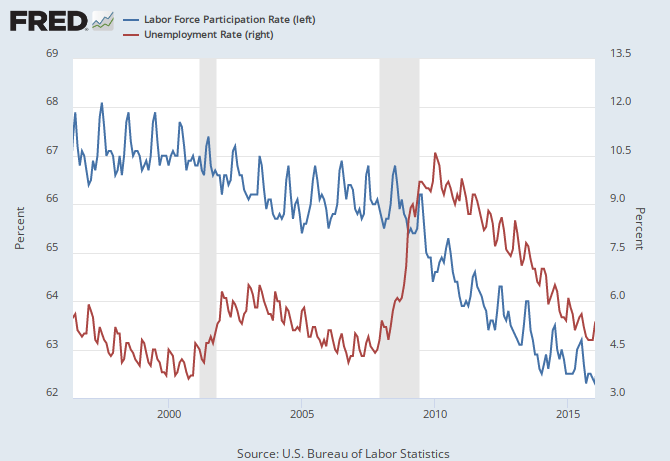
Above note, the following declines, participation rate from 1998 68 to present 62.3; Jan 08 65.7, Jan 16 62.3. Employment to population ratio Jan 08 62.2, Jan 16 59.0. And note the following increases, unemployed Jan 08 8.221M, Jan 16 8.309M and we save the best for last: not counted in labor force Jan 08 79.7M; Jan 16 95.0M = 15 million not counted as unemployed, no wonder the unemployment rate is at a 8 year "low". It blows my mind that people actually buy into this BS media narrative.
Although Hibor has calmed down, excepting ON (overnight) the curve is inverted.
Oil Bullish and Bearish: COTS Oil shorts +30.9k to 348.9k for a new record high. Oil longs +22.1k to 545.8k for the largest gross long position since the mid 2014 peak in oil prices. Try what Hess just did, buy back 63M shares at $83 and sell 25M at $39 and they might not be the last ones to do it. Oil must find support and break through resistance to the upside or fail to the downside, in which case its back to 27, failure there, 22.
In October 2015... after global equities most painful quarterly performance in four years wiped more than $10T off shares worldwide, Citi analysts had this to report:
"Collectively, Citi strategists forecast a 20% gain in global equities to end-2016. We suspect that the markets have already moved to price in a mild global EPS contraction, but our bullish view would clearly be at risk given a more severe recession. Only once we see how strong the next selloff is, will we be able to say with much confidence that the worst is over.”
Two days ago, those same Citi analysts... "Stronger U.S. dollar, weaker oil/commodity prices, weaker world trade/petrodollar liquidity, weaker EM (and global growth)... and repeat. Ad infinitum, this would lead to Oilmageddon, a 'significant and synchronized' global recession and a proper modern-day equity bear market."
To recap: Weak global growth spurs demand for the U.S. dollar; a stronger U.S. dollar drives down the global price of commodities; and low commodity prices hurt developing economies dependent on exporting raw materials, thereby weakening global growth, which spurs demand for the U.S dollar, ad infinitum. This process repeats until we arrive at “Oilmageddon," an economic apocalypse defined by perpetually low oil prices and "a 'significant and synchronized' global recession and a proper modern-day equity bear market," - Citi strategist Jonathan Stubbs.
We find the differing of opinions of Citi's analysts between October to February, quite interesting, I guess this latest sell off convinced them. Sounds like these analysts have been reading our Natterings for the last year plus... wash, rinse, spin, repeat, its a self reinforcing vortex of contractionary monetary and economic policy with the dollar getting squeezed up through less petrodollars and credit based Eurodollars.
Along with all the miner rally; commodities and oil "bottoming" I've been hearing of late, IMHO, Fridays sell off into the close might indicate that: the post BOJ rotation I previously alluded to is in full swing, the BS jobs report was taken for the disaster it truly is, wages aren't surging (see above). Add negative swap spreads, bank and debt cds reflecting an ugly spectre of coming defaults and tightening credit, weak GDP with recession dead ahead.
Some are connecting the dots so the 1859 to 1940 SP500 rally, could be the dead cat bounce we alluded to as the overall trend reasserts itself. I said ES could test 1930 and to wake me up when it got there, where it was rejected in a big way. I have a funny feeling this Super Bowl, Monday and week could all be ugly. TBD.
Surging wages? Anyone of sound mind can tell by looking at the above chart, that assertion is pure unadulterated BS. An eight year low in unemployment? Let's see about that...
Above note, the following declines, participation rate from 1998 68 to present 62.3; Jan 08 65.7, Jan 16 62.3. Employment to population ratio Jan 08 62.2, Jan 16 59.0. And note the following increases, unemployed Jan 08 8.221M, Jan 16 8.309M and we save the best for last: not counted in labor force Jan 08 79.7M; Jan 16 95.0M = 15 million not counted as unemployed, no wonder the unemployment rate is at a 8 year "low". It blows my mind that people actually buy into this BS media narrative.
Although Hibor has calmed down, excepting ON (overnight) the curve is inverted.
Oil Bullish and Bearish: COTS Oil shorts +30.9k to 348.9k for a new record high. Oil longs +22.1k to 545.8k for the largest gross long position since the mid 2014 peak in oil prices. Try what Hess just did, buy back 63M shares at $83 and sell 25M at $39 and they might not be the last ones to do it. Oil must find support and break through resistance to the upside or fail to the downside, in which case its back to 27, failure there, 22.
In October 2015... after global equities most painful quarterly performance in four years wiped more than $10T off shares worldwide, Citi analysts had this to report:
"Collectively, Citi strategists forecast a 20% gain in global equities to end-2016. We suspect that the markets have already moved to price in a mild global EPS contraction, but our bullish view would clearly be at risk given a more severe recession. Only once we see how strong the next selloff is, will we be able to say with much confidence that the worst is over.”
Two days ago, those same Citi analysts... "Stronger U.S. dollar, weaker oil/commodity prices, weaker world trade/petrodollar liquidity, weaker EM (and global growth)... and repeat. Ad infinitum, this would lead to Oilmageddon, a 'significant and synchronized' global recession and a proper modern-day equity bear market."
To recap: Weak global growth spurs demand for the U.S. dollar; a stronger U.S. dollar drives down the global price of commodities; and low commodity prices hurt developing economies dependent on exporting raw materials, thereby weakening global growth, which spurs demand for the U.S dollar, ad infinitum. This process repeats until we arrive at “Oilmageddon," an economic apocalypse defined by perpetually low oil prices and "a 'significant and synchronized' global recession and a proper modern-day equity bear market," - Citi strategist Jonathan Stubbs.
We find the differing of opinions of Citi's analysts between October to February, quite interesting, I guess this latest sell off convinced them. Sounds like these analysts have been reading our Natterings for the last year plus... wash, rinse, spin, repeat, its a self reinforcing vortex of contractionary monetary and economic policy with the dollar getting squeezed up through less petrodollars and credit based Eurodollars.
Along with all the miner rally; commodities and oil "bottoming" I've been hearing of late, IMHO, Fridays sell off into the close might indicate that: the post BOJ rotation I previously alluded to is in full swing, the BS jobs report was taken for the disaster it truly is, wages aren't surging (see above). Add negative swap spreads, bank and debt cds reflecting an ugly spectre of coming defaults and tightening credit, weak GDP with recession dead ahead.
Some are connecting the dots so the 1859 to 1940 SP500 rally, could be the dead cat bounce we alluded to as the overall trend reasserts itself. I said ES could test 1930 and to wake me up when it got there, where it was rejected in a big way. I have a funny feeling this Super Bowl, Monday and week could all be ugly. TBD.
Comments