Party Like Its 2004? King Dollar, Oil & Equities
King Dollar is still on his perch over at the Empire State Bldg, but is getting beaten about the head by buzzing air planes and plunging from 100 to 96.5 on the DXY, as Mrs. Watanabe, Mrs. Chin, Mrs. Smith, and you can fill in the blank, are going to cash and rotating assets.
Those banks and dealers must liquidate positions to convert their reserves to cash vault to meet depositor demands. I don't care where those banks or dealers are, they or their central banks are liquidating dollar denominated positions to dole out the local cash or electronic credits, flooding the market with USD, driving the KING nuts and taking down equities markets.
Something slimy, oily and scary indeed, this chart....
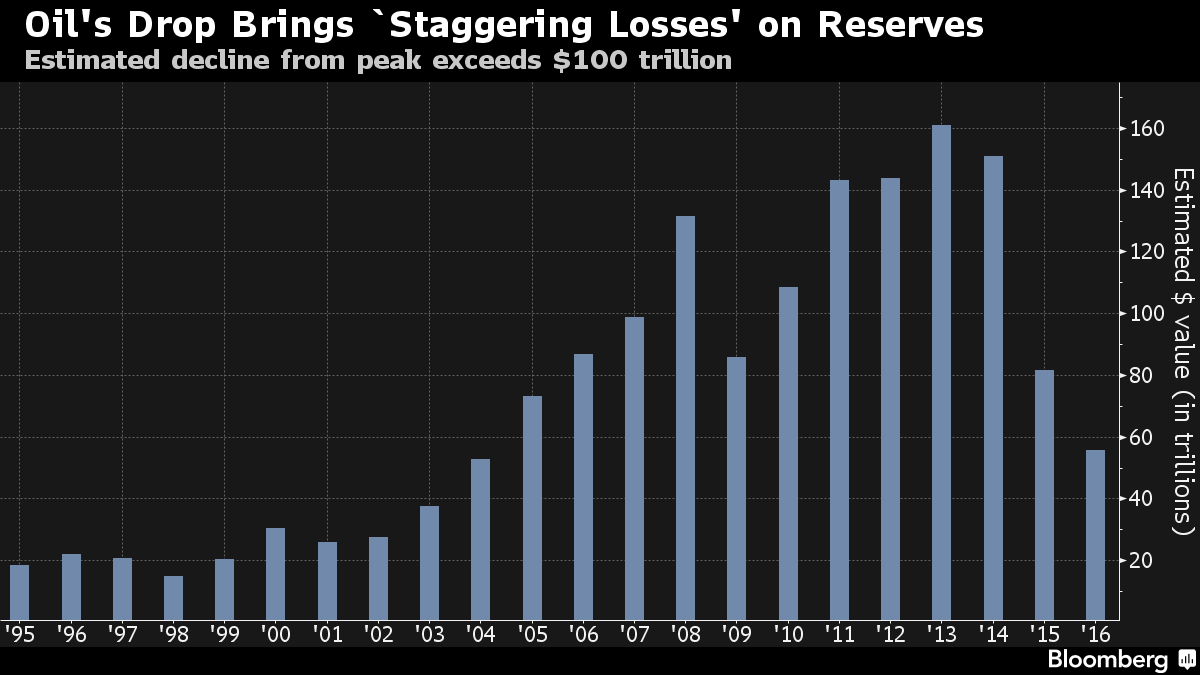
Note above, since 2013 a contraction in global oil asset value of $100T over the last 26 months. Taking total valuation back to 2004 levels, the year we penned this:
"London's (IPE), has reported that its trade with Brent Crude oil contracts reached 375 million barrels in open-interest contracts on May 14, 2004, the highest level ever. This is about five times the total daily production of all sorts of oil worldwide. The daily turnover of Brent Crude future contracts at the IPE now approximates twice the global daily production of oil. "
What was the SP500 at in June 2004? About 1140, and it could be in the process of heading there-about's right now. Can't happen you say? Wrong, dead wrong. Oil has already done it along with commodities, equities are in the barrel now, bonds might be next. And the fat lady of debt defaults, negative GDP and further PE and EPS contraction, is just warming up. TBD. Food for thought.
Since we are waxing nostalgic, here's some food for thought from March 2005, As The Market Churns. Albeit a bit old such as moi, but never beyond its stale date. Why the redux? There might be some relevant pearls buried in that one and because sometimes, the more things change, the more they stay the same. Out.
Those banks and dealers must liquidate positions to convert their reserves to cash vault to meet depositor demands. I don't care where those banks or dealers are, they or their central banks are liquidating dollar denominated positions to dole out the local cash or electronic credits, flooding the market with USD, driving the KING nuts and taking down equities markets.
Something slimy, oily and scary indeed, this chart....
Note above, since 2013 a contraction in global oil asset value of $100T over the last 26 months. Taking total valuation back to 2004 levels, the year we penned this:
"London's (IPE), has reported that its trade with Brent Crude oil contracts reached 375 million barrels in open-interest contracts on May 14, 2004, the highest level ever. This is about five times the total daily production of all sorts of oil worldwide. The daily turnover of Brent Crude future contracts at the IPE now approximates twice the global daily production of oil. "
What was the SP500 at in June 2004? About 1140, and it could be in the process of heading there-about's right now. Can't happen you say? Wrong, dead wrong. Oil has already done it along with commodities, equities are in the barrel now, bonds might be next. And the fat lady of debt defaults, negative GDP and further PE and EPS contraction, is just warming up. TBD. Food for thought.
Since we are waxing nostalgic, here's some food for thought from March 2005, As The Market Churns. Albeit a bit old such as moi, but never beyond its stale date. Why the redux? There might be some relevant pearls buried in that one and because sometimes, the more things change, the more they stay the same. Out.
Comments