The Fallout 5: Positive Signs?
Continued from Part 4
Some do not see a market top or impending reversal of the ongoing upward trend. Here are several observations to factor into the equation.
CBOE PUT/CALL RATIO Derek Capo
The ratio can provide investors enough information to estimate the possibility of a small (5%), medium (10%) and a large correction (20% or more).
Based on an analysis of the SP500 & CBOE Put/Call data from 2004 to present, 2709 trading days.
Observation #1: A Put/Call Ratio of less than 0.70 signaled a "Green" for strong buy or hold.
Observation #2: The ratio of 1.5 or higher would register a "Red" signal and would warn of a looming correction of more than 20% over the next 1 to 2 years and a sign of a market top.
Observation #3. "Yellow" signals that registered ratios of 1.00 to 1.4 on consistent basis (example 10 days in a row) signaled an upcoming small or medium correction.
So, what happened in 2013 and so far in 2014?
No "Red" signals have been registered in both years.
In 2014, we have seen a mix of "Yellow" and "Green" signals.
From January to July 24th there are 141 trading days yet the ratio registered 14 "Yellow," 7 "Green" and NO "Red." Even after the market dropping about 4% to 5% last week the ratio still hasn't registered any "Red" signals.
ECONOMIC DATA Cris Sheridan
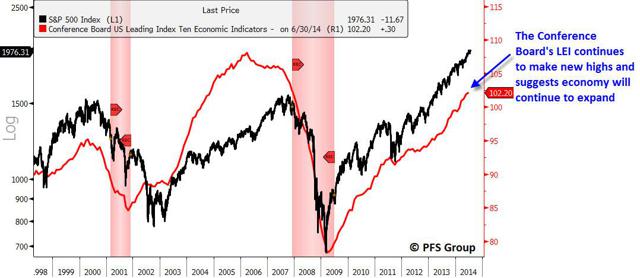
The Conference Board's Leading Economic Index (in red), measures a wide range of economic data across the U.S. and shows the main trend is still positive (S&P 500 in black). Until this and other LEIs begin to weaken and reverse trend, the overall economic backdrop is favorable.
FINANCIAL STRESS
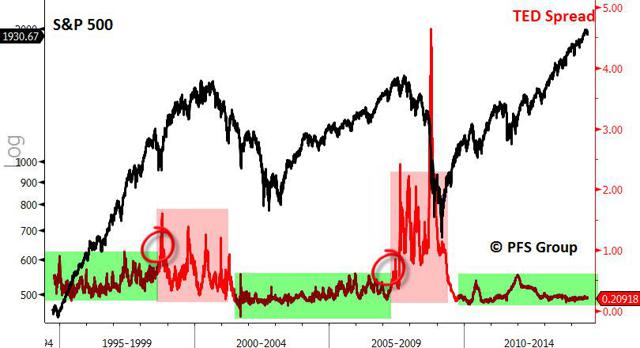
The TED spread is a well-known way to measure the level of financial stress between large banks and, as you can see, highly correlates with major tops in the market as pressures begin to exert themselves within the economy and wider financial system. Current levels of financial stress are quite low and not showing the signs we'd expect to see near a top in the market.
PROFIT MARGINS
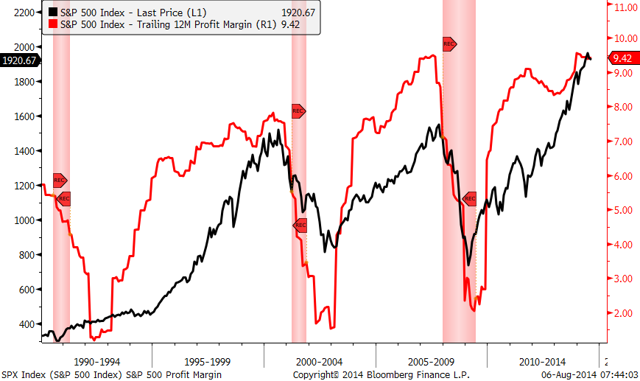
The stock market rises. However, as Investopedia says, "the earnings of a company often doesn't tell the entire story." For that, you have to look at profit margins, which take into account costs as well.
Here we provide a chart of the collective profit margins of S&P 500 companies. As you can see, profit margins peak along with the stock market and often signal the beginning of a bear market, something which hasn't happened yet.
When we look at the direction of U.S. economic data, the probability of a recession, levels of financial stress, and corporate profit margins the message is clear: we are not yet seeing any of the tell-tale signs associated with a major peak or beginning of a bear market in U.S. stocks.
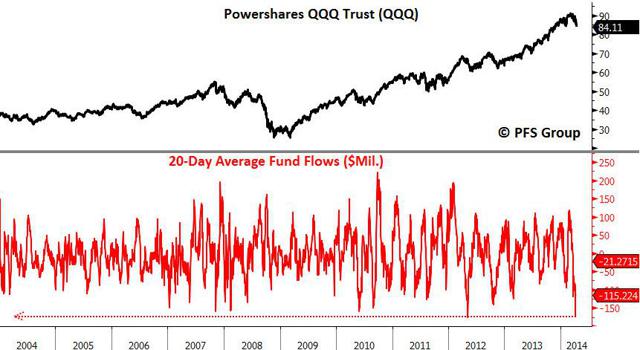
ETF OUTFLOWS Chris Puplava
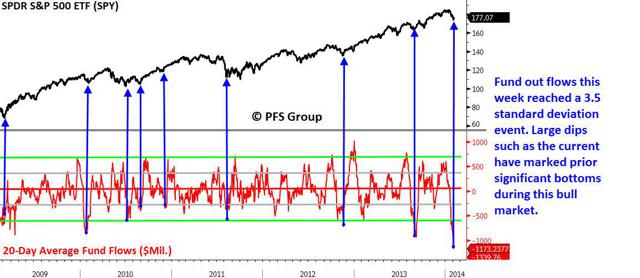
To do this, first identify which areas of the market are getting hit the hardest, look at a widely followed ETF for that market, and then watch for fund outflows to hit an extreme to mark capitulation. Capitulation selling in the SPY and QQQ marked earlier bottoms this year.
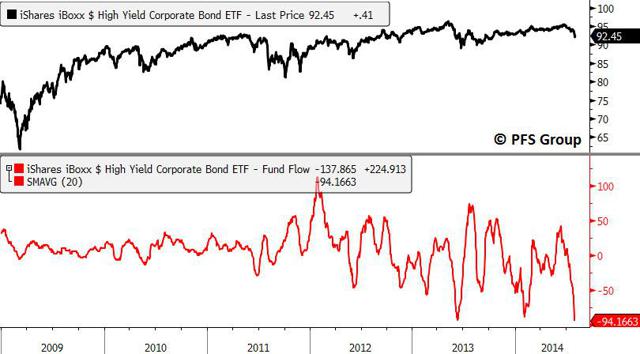
JUNK BONDS
We've clearly seen capitulation in the junk bond market as the 20-day average of outflows from the iShares High Yield Corporate Bond ETF (NYSEARCA:HYG) reached the worst outflows seen since the bull market began in 2009 as nearly $100M in average daily outflows have taken place in the last 20 days.
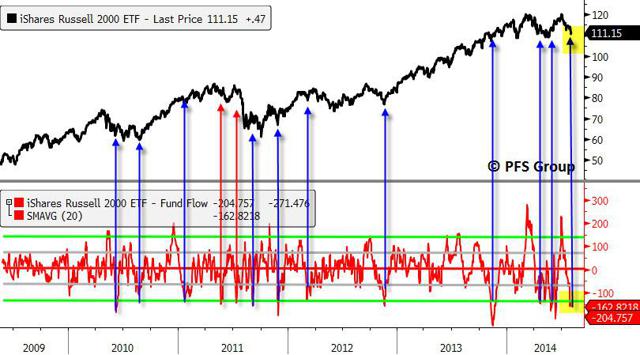
R2K
Even greater outflows were seen in the iShares Russell 2000 ETF (NYSEARCA:IWM), which averaged $162M in daily outflows over the last 20 days.
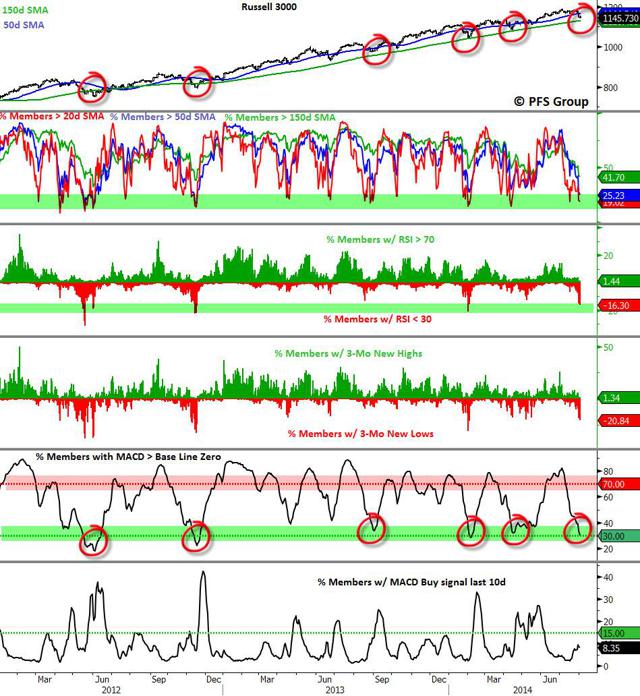
MACD - So Bearish It's Bullish
Last Thursday I highlighted that breadth had turned so bearish that we were reaching levels associated with market bottoms. For gauging market breadth I analyze the Russell 3000, which makes up roughly 98% of the entire US market capitalization.
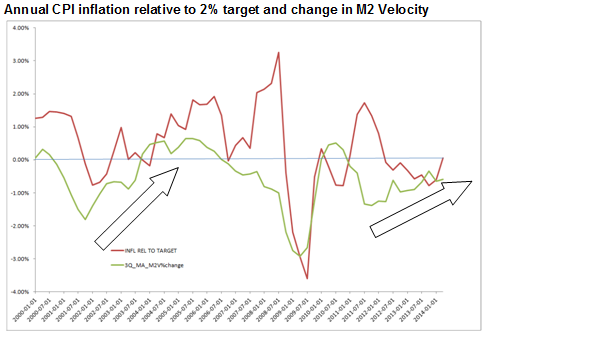
INFLATION BUILDING Mike Parmar
A number of trends in monetary aggregates that correlate to inflation gains, such as credit expansion or growth in M2 Velocity, are signaling inflation could accelerate.
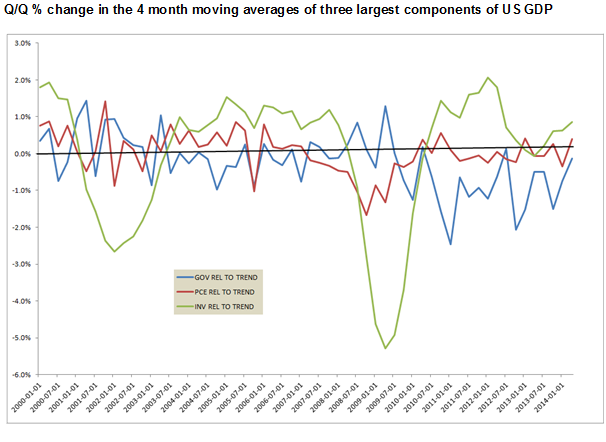
Personal Consumption Expenditures are rising at trend rate;
Investment spending is rising above trend rates;
The reduction in Government spending appears to be coming to an end.
Some do not see a market top or impending reversal of the ongoing upward trend. Here are several observations to factor into the equation.
CBOE PUT/CALL RATIO Derek Capo
The ratio can provide investors enough information to estimate the possibility of a small (5%), medium (10%) and a large correction (20% or more).
Based on an analysis of the SP500 & CBOE Put/Call data from 2004 to present, 2709 trading days.
Observation #1: A Put/Call Ratio of less than 0.70 signaled a "Green" for strong buy or hold.
Observation #2: The ratio of 1.5 or higher would register a "Red" signal and would warn of a looming correction of more than 20% over the next 1 to 2 years and a sign of a market top.
Observation #3. "Yellow" signals that registered ratios of 1.00 to 1.4 on consistent basis (example 10 days in a row) signaled an upcoming small or medium correction.
So, what happened in 2013 and so far in 2014?
No "Red" signals have been registered in both years.
In 2014, we have seen a mix of "Yellow" and "Green" signals.
From January to July 24th there are 141 trading days yet the ratio registered 14 "Yellow," 7 "Green" and NO "Red." Even after the market dropping about 4% to 5% last week the ratio still hasn't registered any "Red" signals.
ECONOMIC DATA Cris Sheridan
The Conference Board's Leading Economic Index (in red), measures a wide range of economic data across the U.S. and shows the main trend is still positive (S&P 500 in black). Until this and other LEIs begin to weaken and reverse trend, the overall economic backdrop is favorable.
FINANCIAL STRESS
The TED spread is a well-known way to measure the level of financial stress between large banks and, as you can see, highly correlates with major tops in the market as pressures begin to exert themselves within the economy and wider financial system. Current levels of financial stress are quite low and not showing the signs we'd expect to see near a top in the market.
PROFIT MARGINS
The stock market rises. However, as Investopedia says, "the earnings of a company often doesn't tell the entire story." For that, you have to look at profit margins, which take into account costs as well.
Here we provide a chart of the collective profit margins of S&P 500 companies. As you can see, profit margins peak along with the stock market and often signal the beginning of a bear market, something which hasn't happened yet.
When we look at the direction of U.S. economic data, the probability of a recession, levels of financial stress, and corporate profit margins the message is clear: we are not yet seeing any of the tell-tale signs associated with a major peak or beginning of a bear market in U.S. stocks.
ETF OUTFLOWS Chris Puplava
To do this, first identify which areas of the market are getting hit the hardest, look at a widely followed ETF for that market, and then watch for fund outflows to hit an extreme to mark capitulation. Capitulation selling in the SPY and QQQ marked earlier bottoms this year.
JUNK BONDS
We've clearly seen capitulation in the junk bond market as the 20-day average of outflows from the iShares High Yield Corporate Bond ETF (NYSEARCA:HYG) reached the worst outflows seen since the bull market began in 2009 as nearly $100M in average daily outflows have taken place in the last 20 days.
R2K
Even greater outflows were seen in the iShares Russell 2000 ETF (NYSEARCA:IWM), which averaged $162M in daily outflows over the last 20 days.
MACD - So Bearish It's Bullish
Last Thursday I highlighted that breadth had turned so bearish that we were reaching levels associated with market bottoms. For gauging market breadth I analyze the Russell 3000, which makes up roughly 98% of the entire US market capitalization.
INFLATION BUILDING Mike Parmar
A number of trends in monetary aggregates that correlate to inflation gains, such as credit expansion or growth in M2 Velocity, are signaling inflation could accelerate.
Personal Consumption Expenditures are rising at trend rate;
Investment spending is rising above trend rates;
The reduction in Government spending appears to be coming to an end.
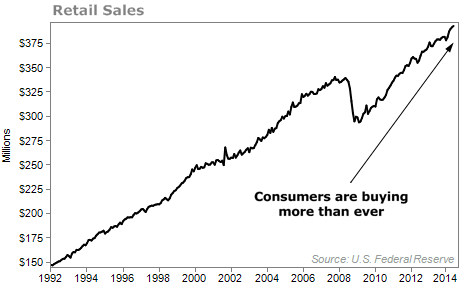
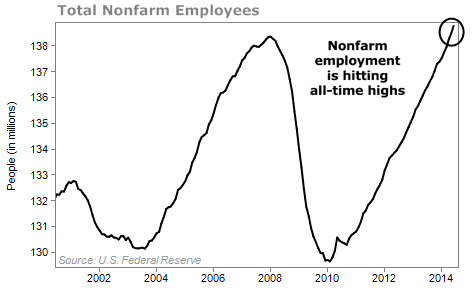
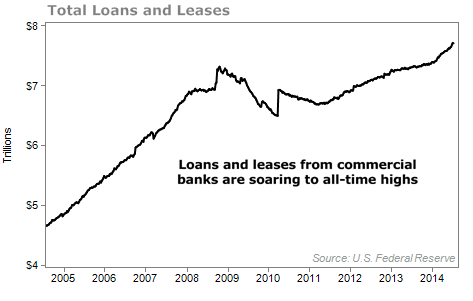
SPENDING, EMPLOYMENT, LOANS Dr. David Eifrig
The Nattering One muses.... with the exceptions of the CBOE put/call ratio and a low TED spread, we could argue that each one of these charts is characteristic of a market top.
After a beer, well maybe not, we're going on Shore Patrol to find some negative signs in our next installment. More to come in Part 6.
After a beer, well maybe not, we're going on Shore Patrol to find some negative signs in our next installment. More to come in Part 6.
Comments