The Housing Conundrum
Joe Calhoun accurately notes... Housing relates more to income than credit.
The end result is as it has been since early 2013. The pace of construction has slowed down to a significant degree.
Single family construction is rather lackluster and ultimately depressing given expectations for this formerly primary monetary policy channel.
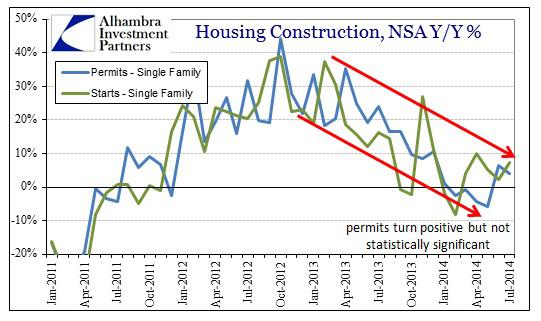
Stagnant earnings explain an economy that’s having trouble sustaining a rebound in housing and consumer spending.
 In other words, the economy is, for "some" reason, not acting like an economy.
These figures demand reconciliation with true wealth, which is where wages actually come from, instead the conversation will remain in the paper domain of credit, credit and more credit.
Job "expansion", such that it may actually exist, has been limited to servicing those with direct access to inflation, mostly of the asset variety. That is not a basis upon which a construction boom will be laid.
Jeffrey Snider notes: Hard Dollars Back Up Housing Observations
 From our favorite Fannie: "With respect to housing's contribution to growth this year, we have downgraded our outlook following the disappointing housing activity seen during the first half of the year.
On the demand side, there appears to be a conservatism among consumers and their willingness to take on big-ticket purchases, such as homes.
We currently estimate that 2014 will finish lower in total sales figures than 2013 - and that 2015, while stronger than 2013 and 2014, will not be the breakout year some are expecting."
The National Association of Realtors projects a 3% decline in purchases of existing homes this year to about 4.9 million from 5.1 million in 2013.
The Nattering One muses.... Take the NAR number and either double it, or put a 1, in front of it. Here's why...
Declining housing, stagnant income, rising home prices. Say what? That's a non sequitur. First in % change from a year ago...

Oh Nattering One, you are wrong, note the downturn since November 2013, you go now, you finish outside... Not so fast, Joe.... Now, since 1987 scaled to 100 for the peak June 2006....

Ahem, you were saying? As of May 2014, as opposed to the % change from a year ago, according to the indexed method that sucker is still going up. % change YOY is down, but prices as of July are still going UP.
From Dataquick in SoCal or La-La land.... In July, Southern California home sales fell to a 3 year low as supply continued to fall short of demand, some buyers struggled with higher prices, and investor activity fell.
Supply fell short of demand? How the hell do prices fall then? Some buyers struggled with higher prices and investor activity fell, but prices did not.
The median price paid last month was up 7.3% from $385,000 in July 2013.
The June 2014 median was the highest for any month since January 2008. The median has risen on a YOY basis for 28 straight months.
In June, however, the median’s 22-month streak of double-digit YOY gains ended. The peak annual gain during that stretch was 28.3 percent in June 2013.
Cash deals declined to the lowest level in more than four years. Buyers paying cash accounted for 24.5% of July home sales, down from 30% in July last year. The peak was 36.9% in February 2013, and since 1988 the monthly average is 16.6%.
Southland sales have fallen on a YOY basis for 10 consecutive months. YET... The median has risen on a YOY basis for 28 straight months.
The 1st hiccup, YOY sales fall, 2nd hiccup - % change in YOY prices are faltering. Why? Having climbed 50% back to the peak, prices are absurdly high - AGAIN! And the stupid money bin is running dry. When will they learn?
Combine this with the fact that most people have seen negative income growth coupled with rising debt levels. Is this sustainable? This is Deja Vu all over again...
If this is a Fibonacci retracement of an Elliot ABC down wave... from the June 06 peak (100) blowoff to Feb 12 trough, 1st wave down or A -36% (not quite 38.2%); since then 2nd wave up or B +18% or 50% retrace to the peak (right on the money)... whats next?
C, the 3rd wave down should be almost equal in duration and intensity to wave A. In other words, a five year decline to Feb 2002 levels or 55% of peak prices. Who knows? Only the Shadow...
The end result is as it has been since early 2013. The pace of construction has slowed down to a significant degree.
Single family construction is rather lackluster and ultimately depressing given expectations for this formerly primary monetary policy channel.
Stagnant earnings explain an economy that’s having trouble sustaining a rebound in housing and consumer spending.
These figures demand reconciliation with true wealth, which is where wages actually come from, instead the conversation will remain in the paper domain of credit, credit and more credit.
Job "expansion", such that it may actually exist, has been limited to servicing those with direct access to inflation, mostly of the asset variety. That is not a basis upon which a construction boom will be laid.
Jeffrey Snider notes: Hard Dollars Back Up Housing Observations
On the demand side, there appears to be a conservatism among consumers and their willingness to take on big-ticket purchases, such as homes.
We currently estimate that 2014 will finish lower in total sales figures than 2013 - and that 2015, while stronger than 2013 and 2014, will not be the breakout year some are expecting."
The National Association of Realtors projects a 3% decline in purchases of existing homes this year to about 4.9 million from 5.1 million in 2013.
The Nattering One muses.... Take the NAR number and either double it, or put a 1, in front of it. Here's why...
Declining housing, stagnant income, rising home prices. Say what? That's a non sequitur. First in % change from a year ago...
Oh Nattering One, you are wrong, note the downturn since November 2013, you go now, you finish outside... Not so fast, Joe.... Now, since 1987 scaled to 100 for the peak June 2006....
Ahem, you were saying? As of May 2014, as opposed to the % change from a year ago, according to the indexed method that sucker is still going up. % change YOY is down, but prices as of July are still going UP.
From Dataquick in SoCal or La-La land.... In July, Southern California home sales fell to a 3 year low as supply continued to fall short of demand, some buyers struggled with higher prices, and investor activity fell.
Supply fell short of demand? How the hell do prices fall then? Some buyers struggled with higher prices and investor activity fell, but prices did not.
The median price paid last month was up 7.3% from $385,000 in July 2013.
The June 2014 median was the highest for any month since January 2008. The median has risen on a YOY basis for 28 straight months.
In June, however, the median’s 22-month streak of double-digit YOY gains ended. The peak annual gain during that stretch was 28.3 percent in June 2013.
Cash deals declined to the lowest level in more than four years. Buyers paying cash accounted for 24.5% of July home sales, down from 30% in July last year. The peak was 36.9% in February 2013, and since 1988 the monthly average is 16.6%.
Southland sales have fallen on a YOY basis for 10 consecutive months. YET... The median has risen on a YOY basis for 28 straight months.
The 1st hiccup, YOY sales fall, 2nd hiccup - % change in YOY prices are faltering. Why? Having climbed 50% back to the peak, prices are absurdly high - AGAIN! And the stupid money bin is running dry. When will they learn?
Combine this with the fact that most people have seen negative income growth coupled with rising debt levels. Is this sustainable? This is Deja Vu all over again...
If this is a Fibonacci retracement of an Elliot ABC down wave... from the June 06 peak (100) blowoff to Feb 12 trough, 1st wave down or A -36% (not quite 38.2%); since then 2nd wave up or B +18% or 50% retrace to the peak (right on the money)... whats next?
C, the 3rd wave down should be almost equal in duration and intensity to wave A. In other words, a five year decline to Feb 2002 levels or 55% of peak prices. Who knows? Only the Shadow...
Comments