Differing Arm Reset Charts
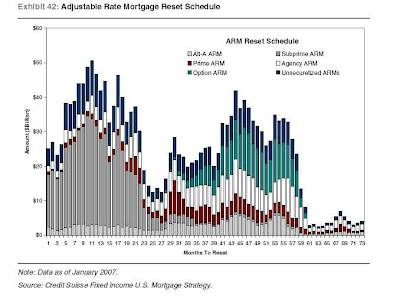
Credit Suisse's chart which we've posted before:
And now Bank of America's chart (hat tip to Calculated Risk)

Noting the Credit Suisse data starts in Jan 07 and rolls forward month by month, it appears one of the two charts has a timeline gone askew.
Not to mention the discrepency in the $ amount volume of ARMS resetting.
In addition, the B of A chart stops in Dec 09 and completely ignores the secondary peaks 30 & 44 months out. Guess by then it won't matter anymore?
My sense is the Credit Suisse chart is probably the more reliable of the two.
Given than B of A actually forked out $2 Billion for non voting Countrywide stock, one would hope that their data might be accurate.
Timing on the 1st peak in from Oct through Dec 07, will be critical for Countrywide's solvency.
Comments